Visualize
Visualize
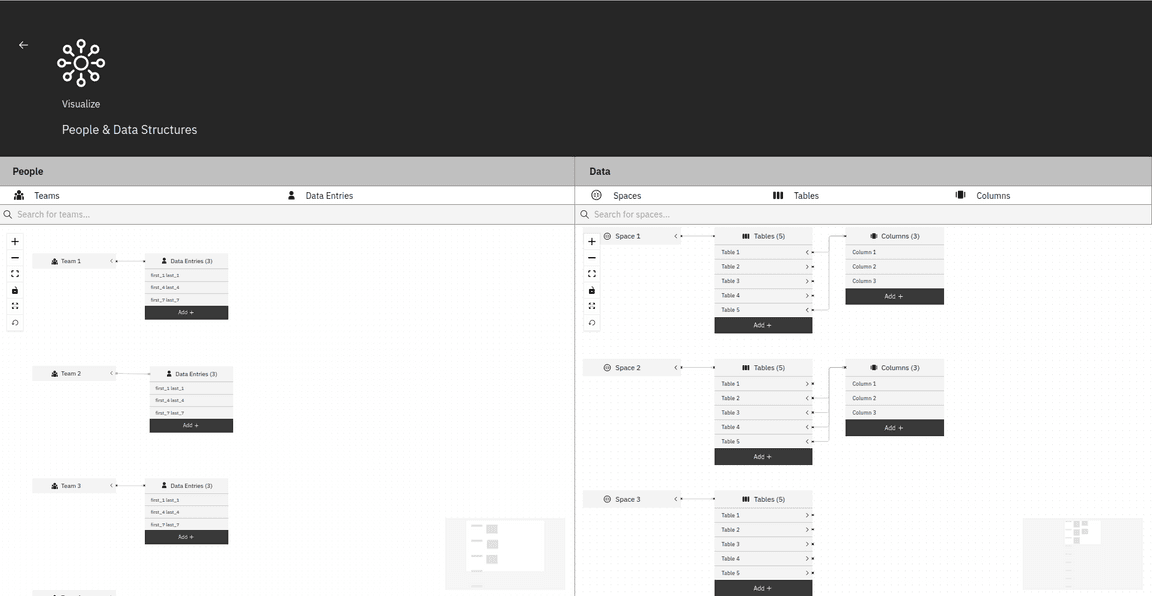
The Visualization page in Jadawel provides a graphical representation of the people and data structure within the system, allowing users to quickly and easily access information about teams, members, spaces, tables, and columns.
On the Visualization page, you can view all the teams in the system. You can then click on a specific team to view its members. This allows you to quickly identify the members within a team and understand the team’s composition.
The Visualization page also allows you to view all the spaces in the system. You can then click on a specific space to view its tables. Clicking on a table will display its columns. This provides a visual representation of the data structure within the system, making it easy to understand the relationships between spaces, tables, and columns.
In addition to viewing existing spaces, tables, and columns, the Visualization page also allows you to add new ones. You can add a new space by clicking on the “Add Space” button, and then specifying the necessary details for the new space. Similarly, you can add a new table by clicking on the “Add Table” button within a specific space, and add a new column by clicking on the “Add Column” button within a specific table. This allows you to easily create new spaces, tables, and columns directly from the Visualization page.
